🌐 Overview
The WhatsApp Dashboard provides a centralized view of:
- Total WhatsApp chat activity
- Chat status distribution (Active, Resolved, Closed)
- Query response-time analysis
- Quick actions for broadcasts and templates
- WhatsApp support team performance
Authorised user can access this dashboard.
🧭 Dashboard Layout
The dashboard is divided into three main sections:
- Top Summary (WhatsApp Support, No-Reply Chat and All with Filters & Timeline Controls)
- Queries Analysis
- Quick Actions
- Support Team Performance Table
🧭 Navigation Path
WhatsApp → Dashboard
The WhatsApp module menu includes:
- Dashboard
- Templates
- Broadcasts
- Support Chat
- No-Reply Chat
- Tickets
- Queries
- Tags List
- Settings
- Chatbot
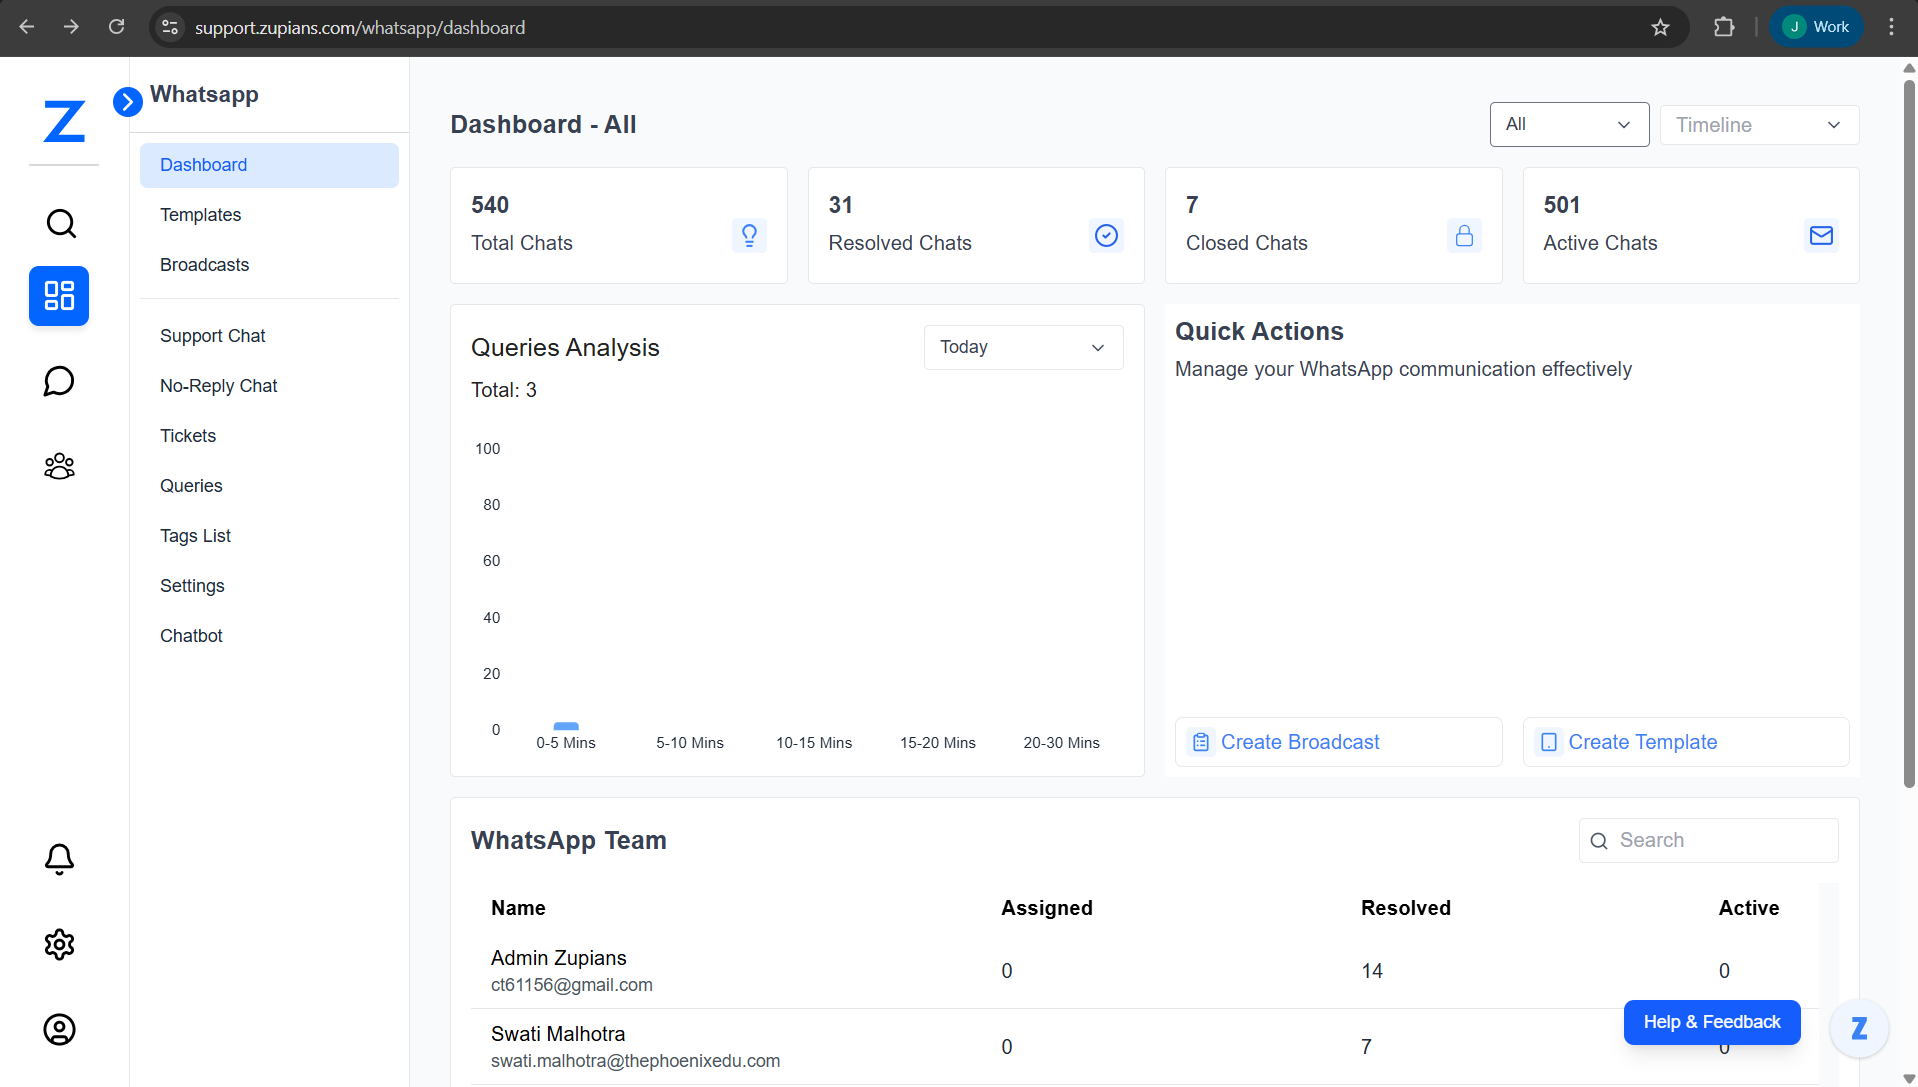
📊 Top Summary Cards
At the top of the dashboard, you’ll see key WhatsApp chat metrics.
Metrics Explained
| Metric | Description |
|---|---|
| Total Chats | Total number of WhatsApp chats received |
| Resolved Chats | Chats successfully handled and marked as resolved |
| Closed Chats | Chats closed manually |
| Active Chats | Ongoing chats awaiting response or action |
High Active Chats indicate pending workload and should be prioritized.
🎛️ Filters & Timeline Controls
Located at the top-right corner of the dashboard.
🔽 Chat Type Filter
- All – Shows all WhatsApp chats for Support and No-Reply. You can also apply specific filter.
🕒 Timeline Filter Options
View data across different time ranges: Today, This Week, This Month, Last 3 Months, and This Year
Available Filter Options
The timeline filter provides comprehensive data analysis across multiple timeframes:
| Timeline Option | Description | Use Case |
|---|---|---|
| Today | Current day data only | Real-time monitoring and daily tracking |
| This Week | Start of current week to today | Weekly performance analysis |
| This Month | Beginning of current month until today | Monthly performance reviews |
| Last 3 Months | Cumulative data for past three months | Medium-term trend analysis |
| This Year | Beginning of current year until today | Annual performance and strategic planning |
📅 Today Filter
- Displays data for the current day only
- Example Usage: Number of chats received and resolved today
- Benefits:
- Real-time monitoring and daily workload tracking
- Immediate performance assessment
- Quick identification of daily bottlenecks
📊 This Week Filter
- Shows data from the start of the current week up to today
- Example Usage: Weekly support performance metrics
- Benefits:
- Understanding weekly support performance patterns
- Identifying workload trends during the week
- Weekly team performance evaluation
📈 This Month Filter
- Displays data from the beginning of the current month until today
- Example Usage: Monthly resolution efficiency tracking
- Benefits:
- Monthly performance reviews and assessment
- Tracking resolution efficiency over extended periods
- Monthly goal achievement monitoring
📊 Last 3 Months Filter
- Shows cumulative data for the past three months
- Example Usage: Quarterly trend analysis and pattern identification
- Benefits:
- Medium-term trend analysis and insights
- Identifying recurring issues or seasonal spikes
- Quarterly performance evaluation
📋 This Year Filter
- Displays data from the beginning of the current year until today
- Example Usage: Annual performance benchmarking
- Benefits:
- High-level performance analysis and reporting
- Strategic planning and long-term goal setting
- Annual trend identification and planning
📈 Queries Analysis
The Queries Analysis section visually represents how quickly support queries are handled within the selected time range.
This graph helps users understand response efficiency by grouping queries based on the time taken to respond or resolve them.
-
Total Queries
Shows the total number of queries received during the selected timeline (for example: Today or This Week). -
Response Time Categories
Queries are grouped into the following response-time ranges:- 0–5 mins – Queries responded to almost immediately
- 5–10 mins – Queries handled within a short waiting period
- 10–15 mins – Queries with a moderate response delay
- 15–20 mins – Queries that required more time to respond
- 20–30 mins – Queries with the longest response time
How to Read the Graph
- The X-axis represents response time ranges (in minutes)
- The Y-axis represents the number of queries
- Each bar indicates how many queries were handled within that time range
- Hovering over a bar displays the exact number of queries for that category
Why This Matters
- Measures overall support response efficiency
- Helps identify delays or bottlenecks in query handling
- Assists in evaluating support team performance
- Enables better planning to improve student satisfaction and response times
⚡ Quick Actions
The Quick Actions panel enables fast execution of common tasks.
Available Actions
- Create Broadcast – Send bulk WhatsApp messages to selected users
- Create Template – Design pre-approved WhatsApp message templates
These shortcuts reduce navigation time for high-frequency actions.
👥 WhatsApp Team Performance
This table displays performance metrics for each WhatsApp support agent.
Columns Explained
| Column | Description |
|---|---|
| Name | Agent name and email |
| Assigned | Chats currently assigned |
| Resolved | Chats resolved by the agent |
| Active | Chats currently in progress |
🔍 Search Agent
- Use the Search box to find agents by name
- Results update instantly
Key Insights
- Identify top performers
- Detect workload imbalance
- Track inactive or overloaded agents
🧪 Step-by-Step Workflows
📅 Daily WhatsApp Monitoring
- Open WhatsApp → Dashboard
- Review Active Chats count
- Check Queries Analysis for response delays
- Scan agent performance table
- Take action on pending or delayed chats
❓ Frequently Asked Questions (FAQ)
1. Who can access the WhatsApp Dashboard?
2. Does the dashboard update in real time?
3. What are Active Chats?
4. What is Queries Analysis used for?
5. Can I send broadcasts from the dashboard?
6. Why do some agents show zero chats?
7. Does timeline filtering affect all widgets?
📌 Summary
The WhatsApp Dashboard enables you to:
- Track real-time WhatsApp support load
- Measure response efficiency
- Monitor agent performance
- Act quickly using broadcasts and templates
Using this dashboard consistently ensures faster responses and better customer satisfaction.